![](https://cdn.myportfolio.com/b043f446-aed3-4c6a-af40-d0fe9ee839d7/0551854c-9a7c-47f4-a4cf-22acd64c1afa_rw_1920.png?h=af5b6dbca637527cd066a445825c72e1)
![](https://cdn.myportfolio.com/b043f446-aed3-4c6a-af40-d0fe9ee839d7/0d583a5f-bf7e-4e98-a038-db446839f718_rw_1920.png?h=7c5cbb606368472515277134c40c3bb3)
![](https://cdn.myportfolio.com/b043f446-aed3-4c6a-af40-d0fe9ee839d7/552d0d88-f658-4bf8-9829-bf58ec47784d_rw_1920.png?h=3816eb3e76721713994fd1b46c1da599)
![](https://cdn.myportfolio.com/b043f446-aed3-4c6a-af40-d0fe9ee839d7/d8600935-186a-4945-b96d-d8cbaf0d2ac5_rw_1920.png?h=45f14371a34e91c83909ddaeb4051cc7)
![](https://cdn.myportfolio.com/b043f446-aed3-4c6a-af40-d0fe9ee839d7/12bdf01c-3384-41c2-acae-86f47706f6e3_rw_1920.png?h=03d71235198ebc58a878859fb913d76f)
![](https://cdn.myportfolio.com/b043f446-aed3-4c6a-af40-d0fe9ee839d7/52f144bf-f632-43cd-b892-77bca36d0643_rw_1920.png?h=d912472361d12c37f8ae1b7436d97ebc)
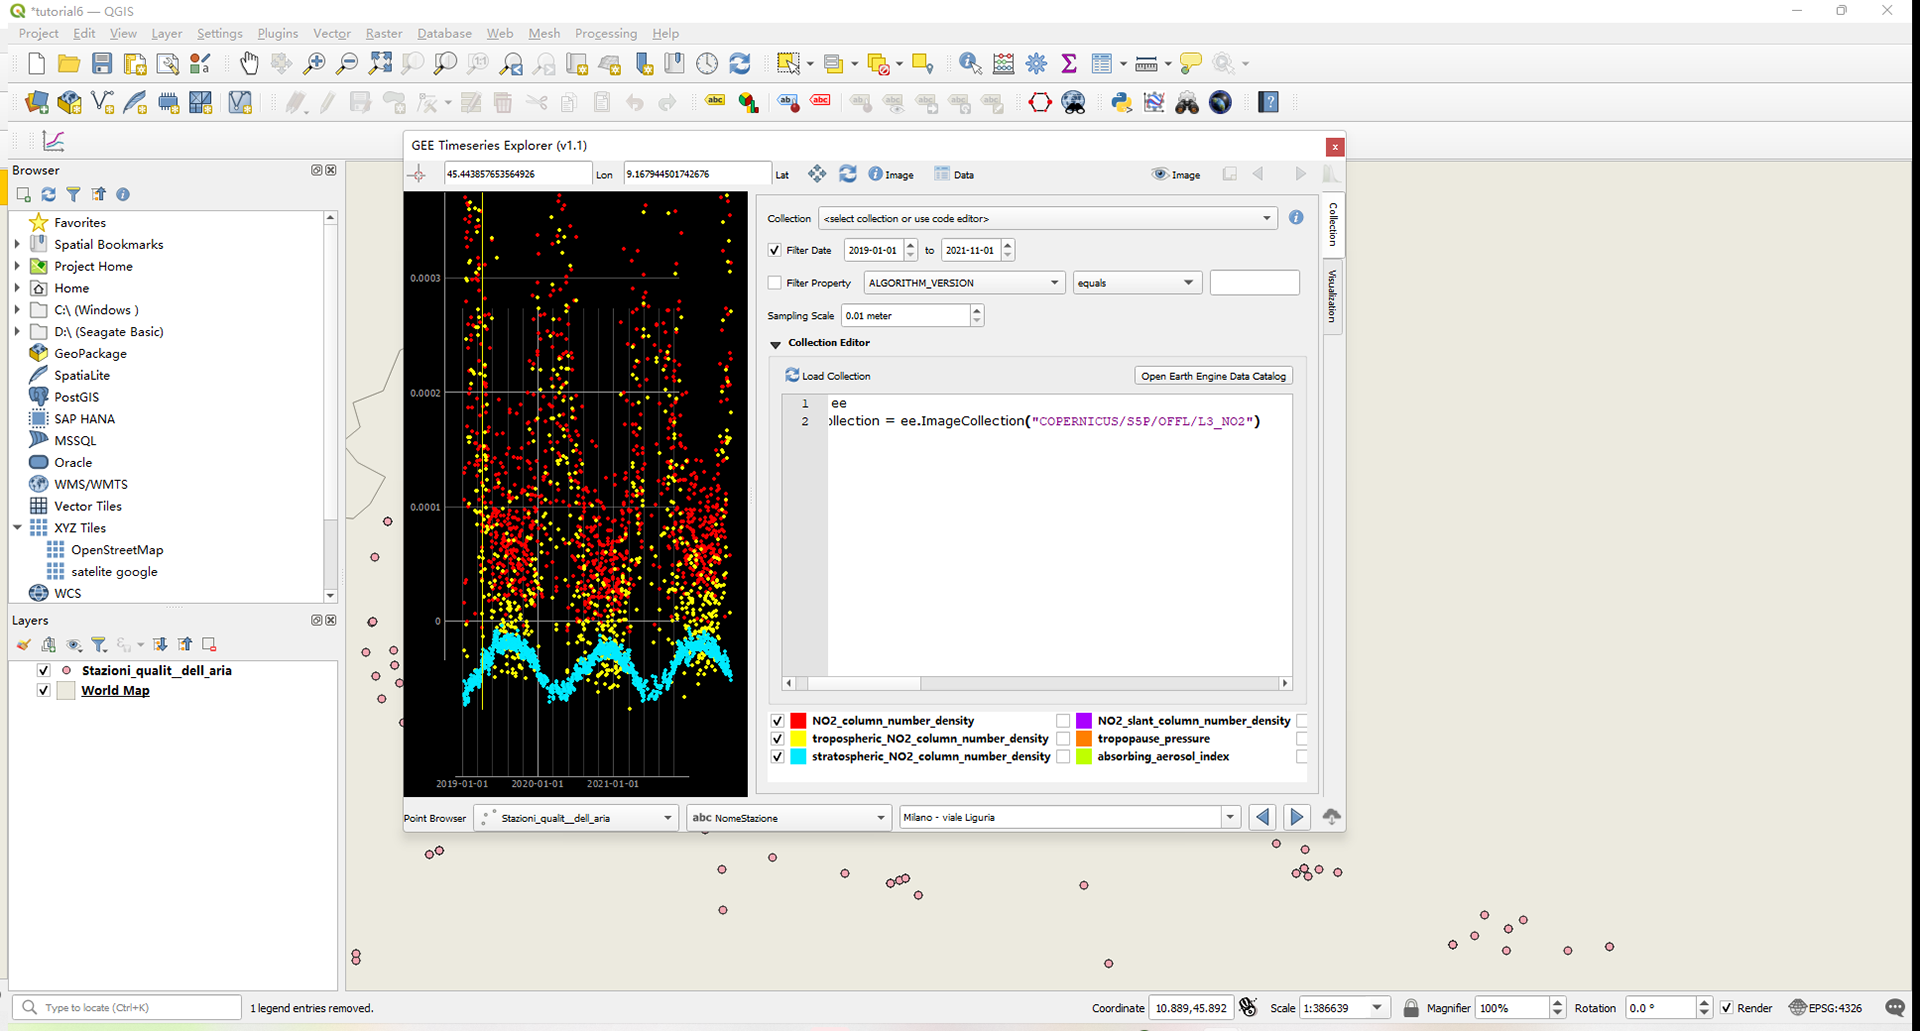
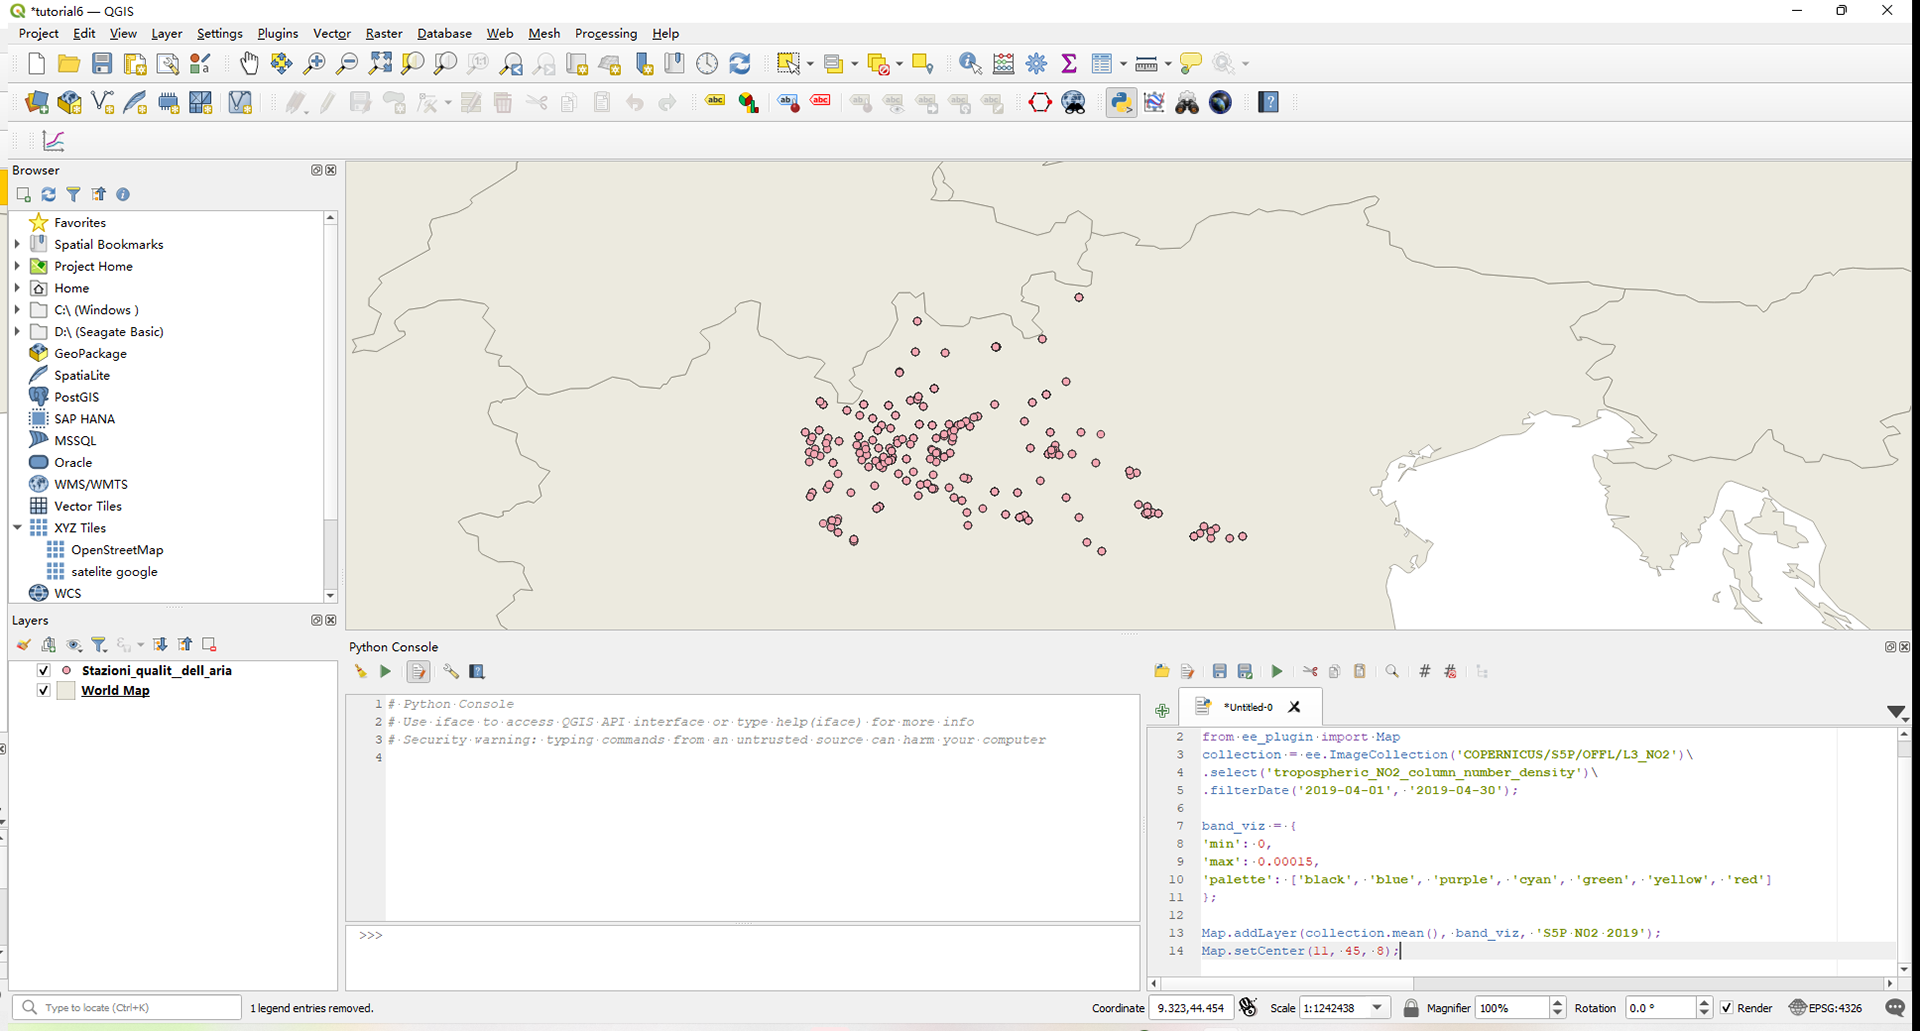
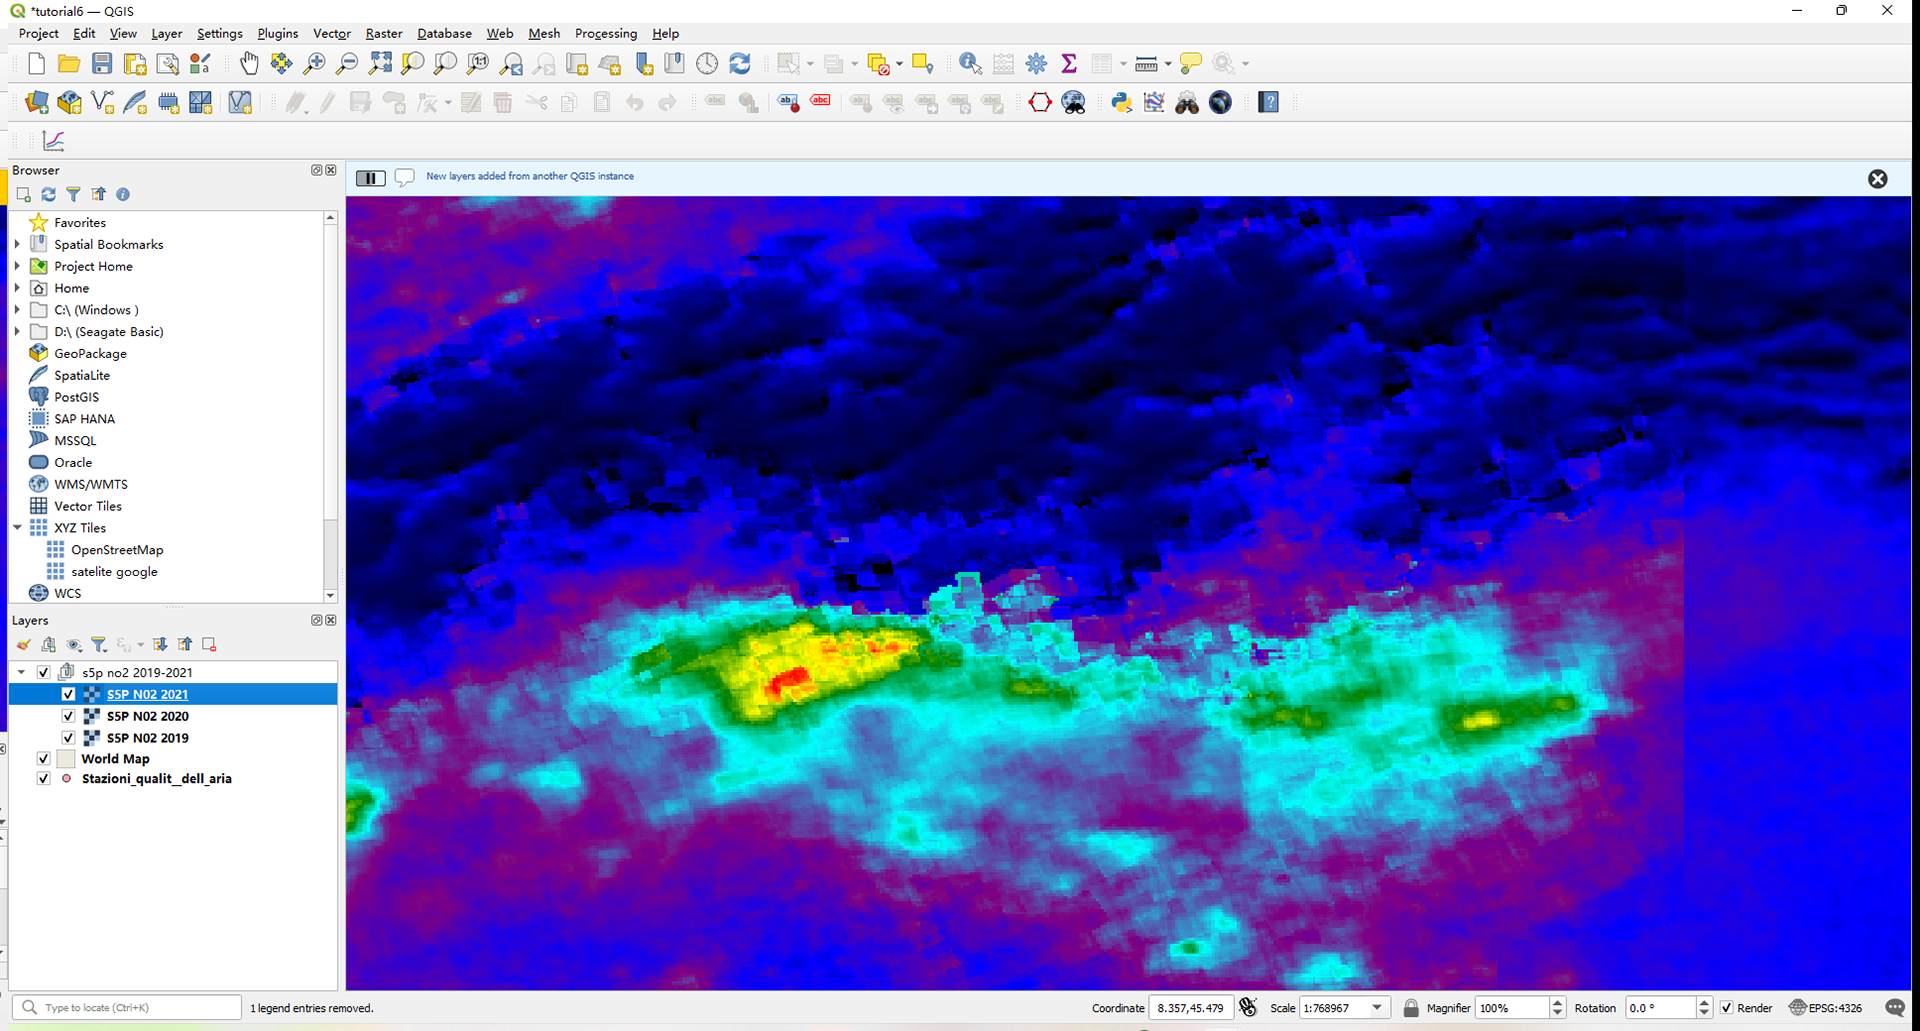
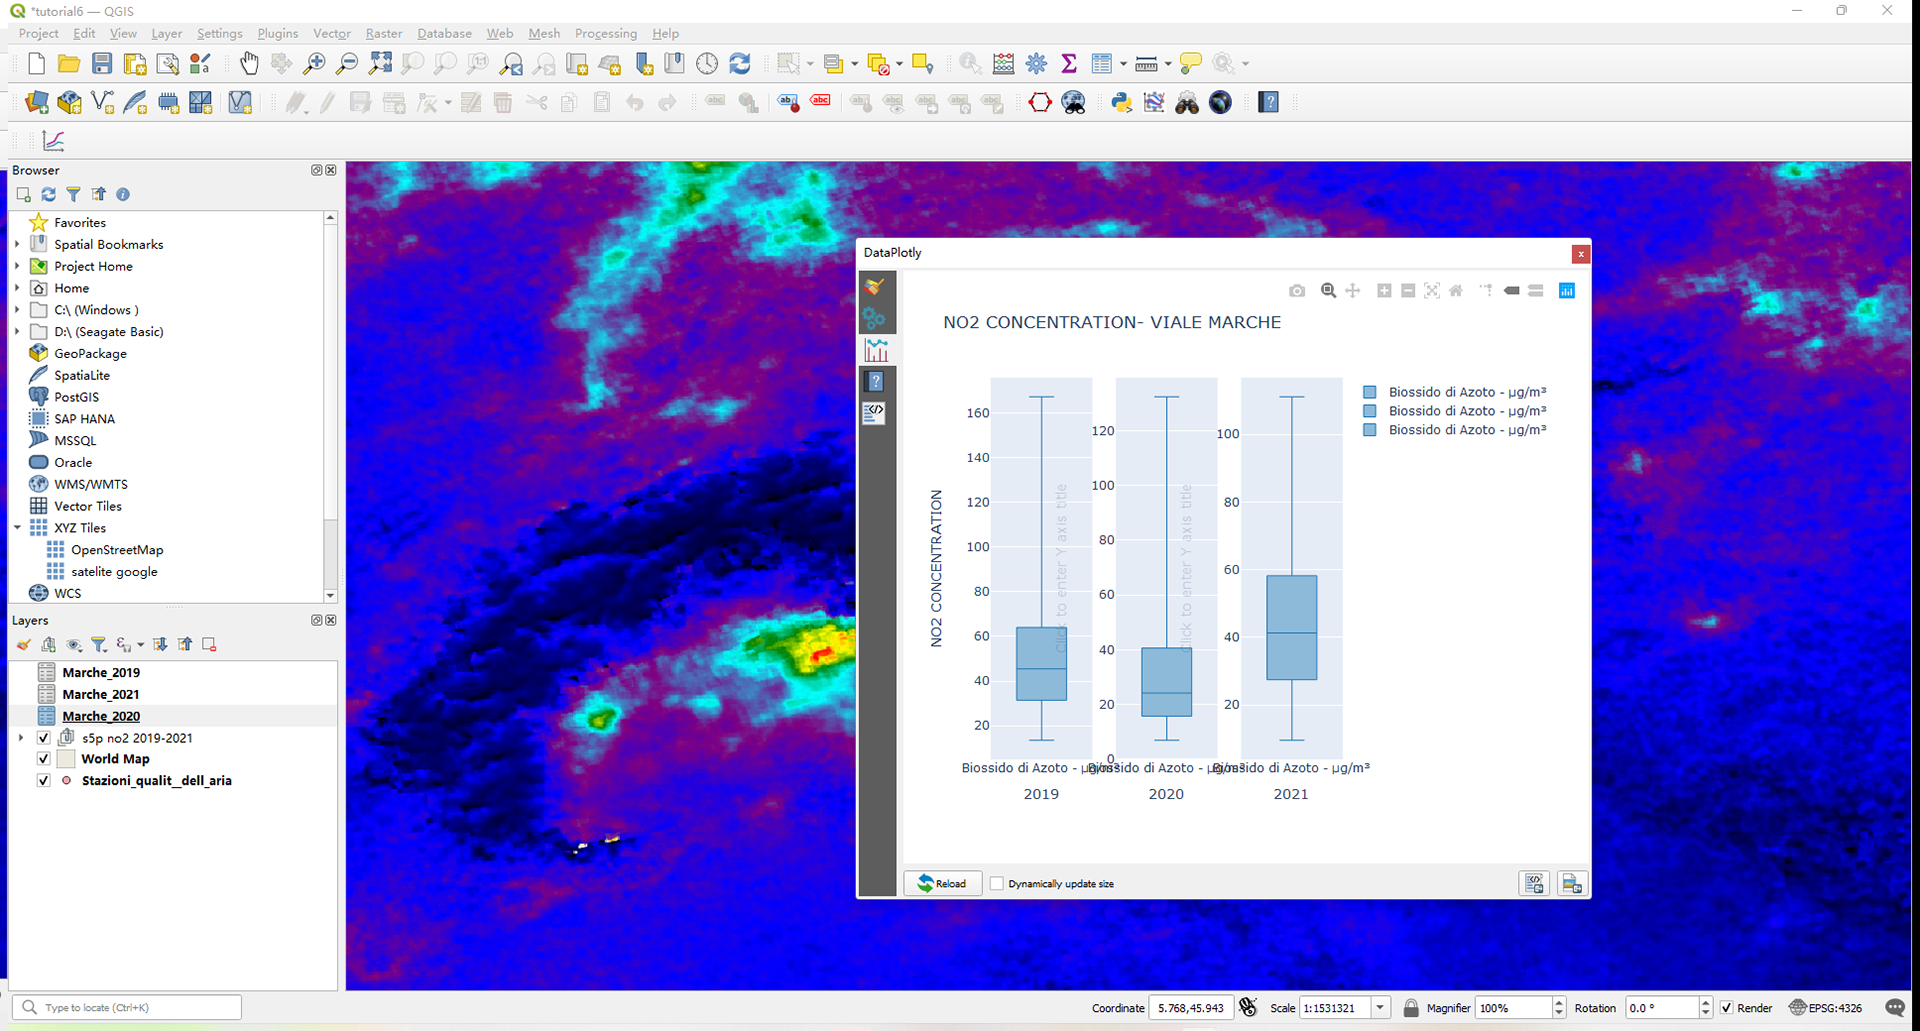
using remotely sensed and ground sensed data the air quality in the area of the “Po Valley”. In particular, remotely sensed data (Sentinel 5P) will be used to map the distribution of Nitrogen dioxide (NO2) in three different time periods: April 2019, April 2020, and April 2021. Ground-based data measured by the ARPA Lombardia will be used to verify the remotely sensed data in the city area of Milan in the same time period.